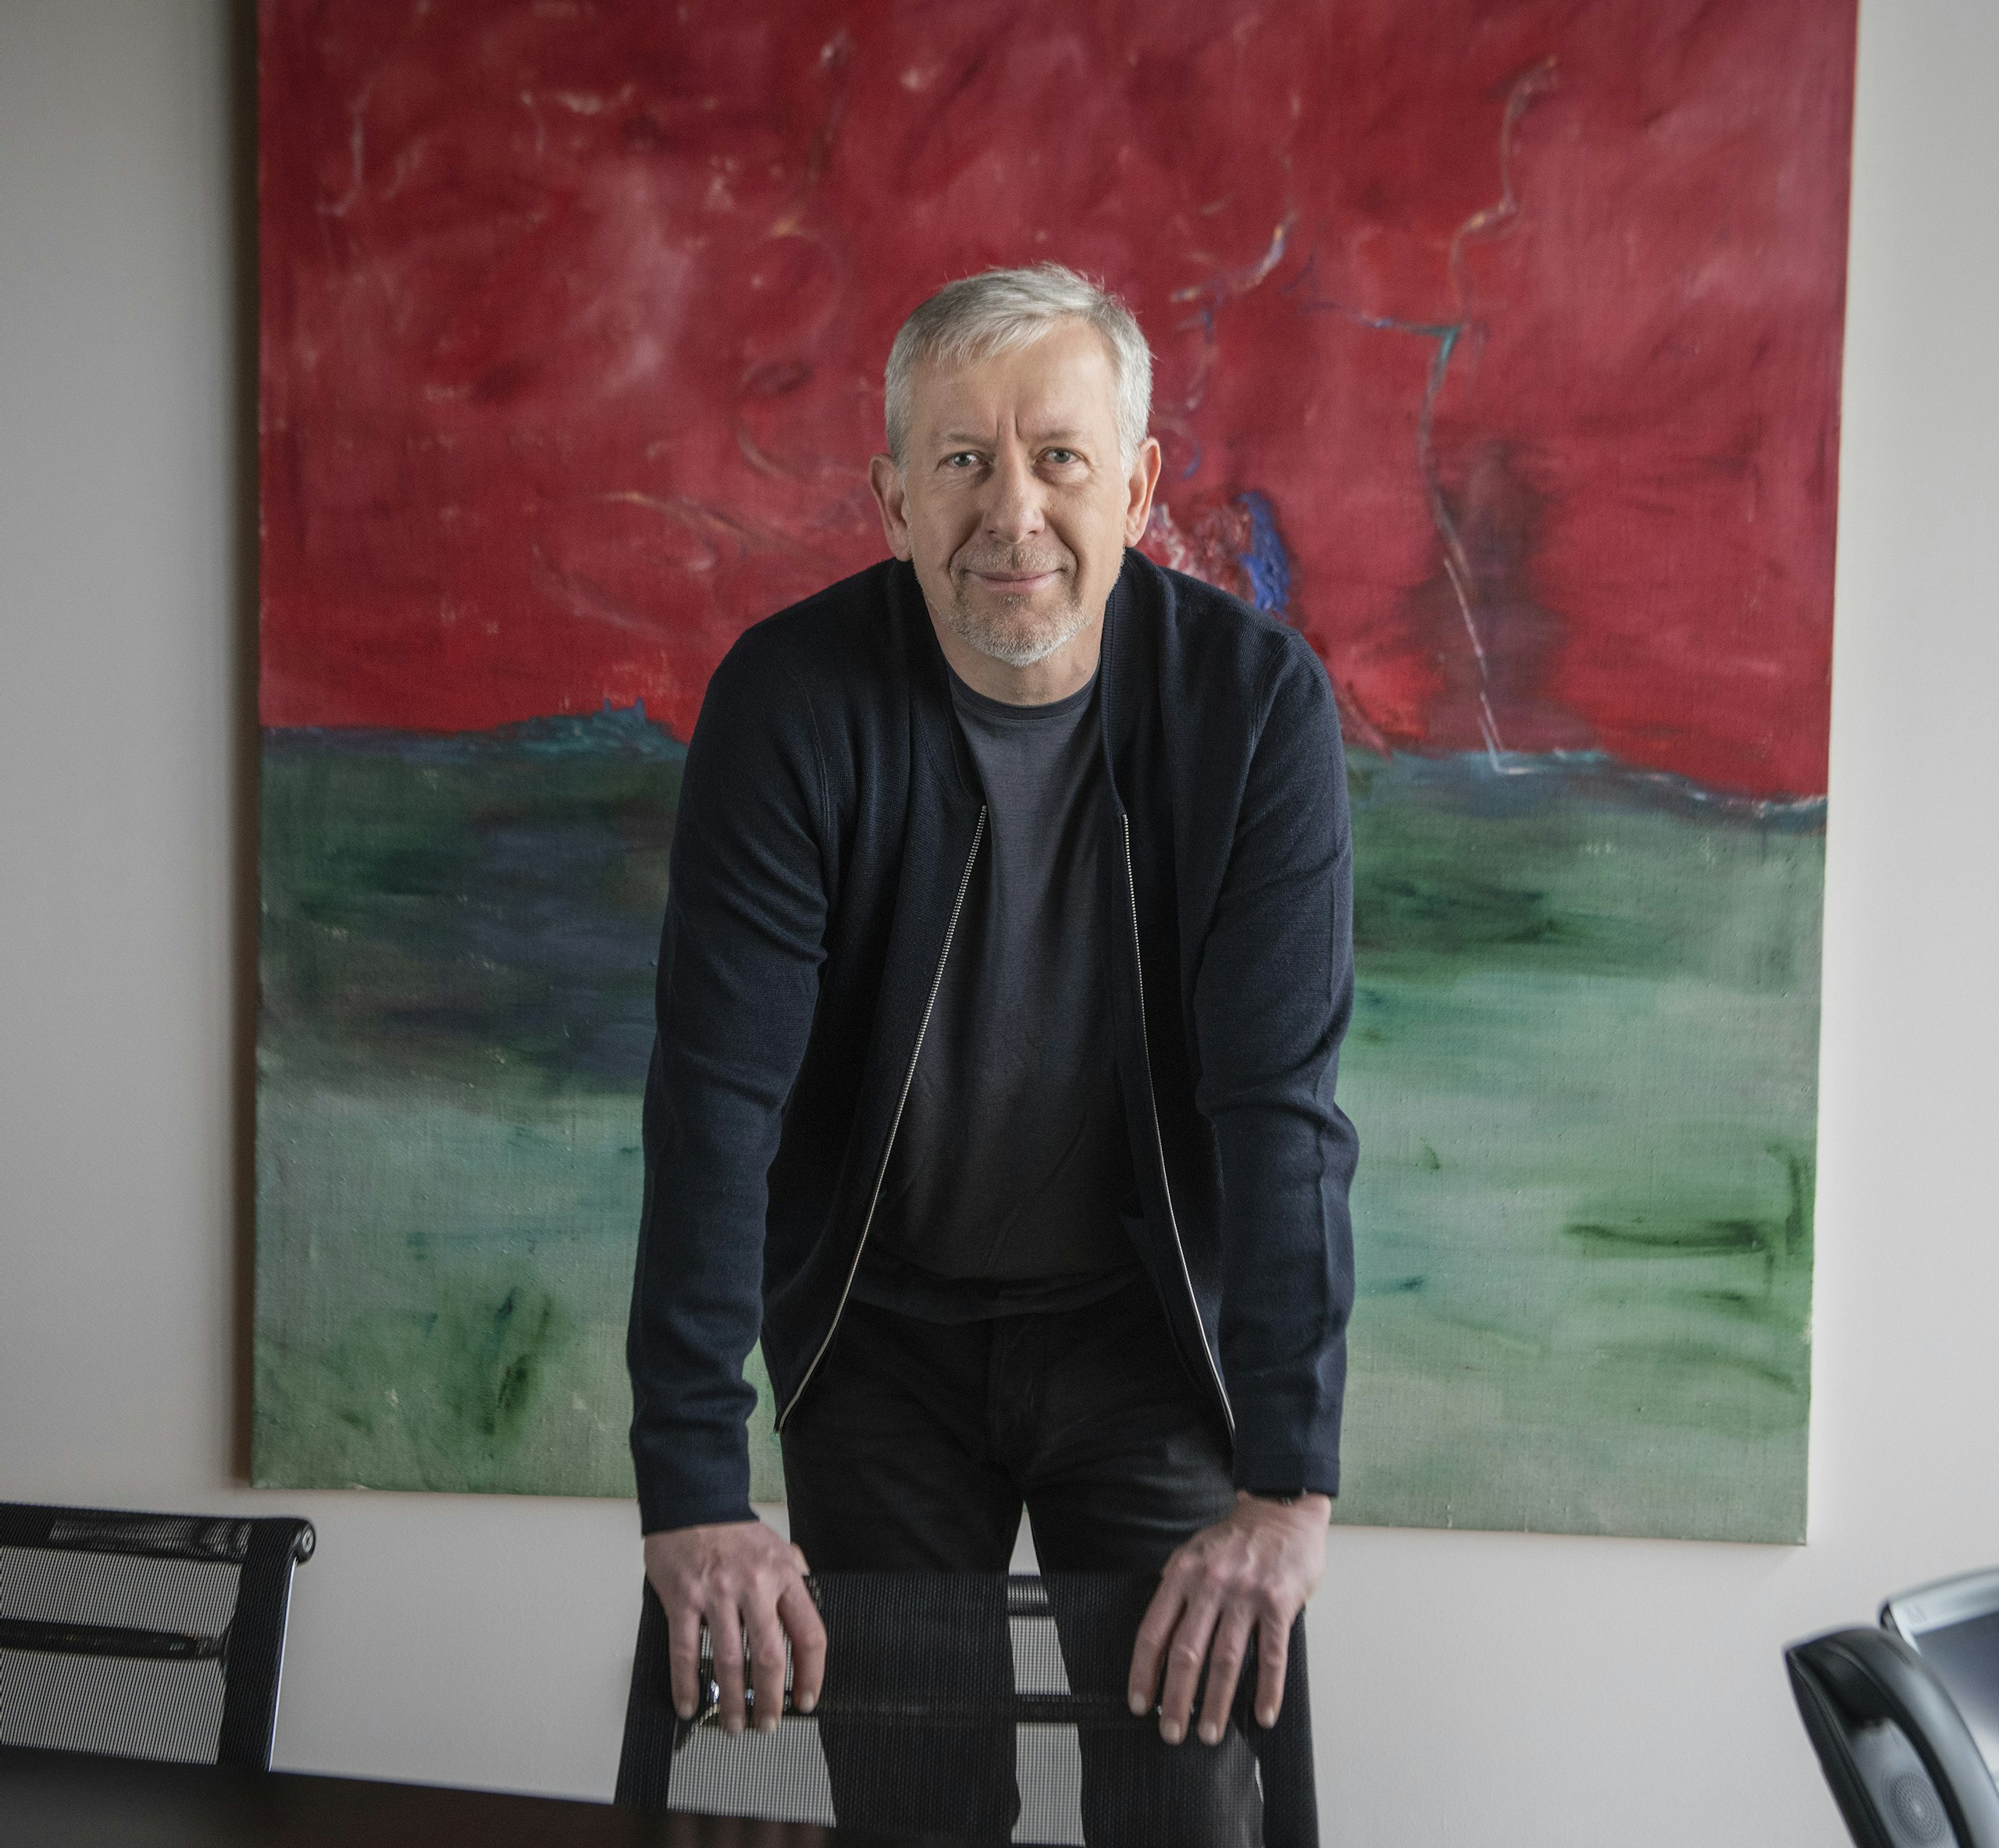
Home Credit B.V.: IFRS consolidated results for the 12 month period ended 31 December 2017
03/07/2018
Broad-based profit growth driven by strong performance
“In 2017, the Group delivered a strong performance across our portfolio of businesses, resulting in good, broad-based profit growth. Within all markets, we have substantially strengthened our market shares and further consolidated our leadership positions while intensifying our focus on implementing efficiency improvements.
Russia, Kazakhstan and Vietnam performed very strongly throughout the year and delivered an excellent increase in profitability. In our Asian start-ups, Indonesia and the Philippines both achieved run-rate profitability during the fourth quarter, and India - where we improved cost effectiveness and further increased our reach - is expected to break even in early 2018.
In China, we have now successfully established a scale position and, although the recent market turmoil will have a short-term impact on our profitability, we continue leading the segment of in-store lending in this significant market.
As we enter 2018, Home Credit remains very well positioned. We have built scale across our growth markets and we are seeing improving customer satisfaction and enhanced competitiveness across the Group. I remain highly confident in the ability of our employees and the Group to deliver.”
Jiri Smejc,
Group CEO and Chairman of the Board of Directors, Home Credit B.V.
GROUP OVERVIEW
2017 has been another good year for Home Credit as the Group maintained growth momentum across its global operations. This resulted in an increase in net profit to EUR 244 million. The Group again demonstrated that the strength of its portfolio, geographical diversification, and its ability to execute, underpin its leading position in consumer finance, especially in the fast-growing mobile communications financing market.
Home Credit’s global in-store presence, incorporating 399,228 points of sale, is a key pillar of its distribution model. This is complemented by online lending offers to existing, lower-risk customers. In addition, the Group’s significant scale in its key markets, including Russia, China and India, makes it an attractive partner for major retailers and manufacturers.
The Group is also increasingly transforming itself into a consumer finance fintech. It has introduced fully paperless processes, chatbots, QR-code based revolving products and multi-functional mobile applications. Newly-digitized processes have also translated into enhanced customer experience. Meanwhile, fintech innovations have improved our risk analytics and give our scorecards much stronger predictive power, leading to faster approvals. This combination provides greater efficiency and better cross-selling opportunities.
SUBSTANTIAL PROFIT CONTRIBUTORS
The Russian operation retained its leading position in point-of-sale lending while introducing innovative products and sharpening its focus on the online space, with the share of active clients using online services reaching 48%. The business delivered an excellent increase in profitability: consolidated net profit was EUR 216 million in 2017, compared to EUR 104 million a year earlier.
In 2017, our Russian bank launched the “Marketplace”, an online aggregator of consumer durables available at 0%-interest loans subsidized by participating retailers and manufacturers. The new 0%-interest shopping card is another flagship product which offers value propositions in line with the overall new brand positioning. Cash loan cross-sells registered double-digit growth with strong risk controls maintained. The business continued to optimize its loan book’s risk profile which, combined with the strong financial performance, led to Fitch Ratings upgrading HCFB’s Long-Term Issuer Default Rating to BB- with a stable outlook.
The bank in Kazakhstan has also continued its excellent performance based on exceptional sales growth and self-funding capability. Sales increased by 76% year-on-year, driven principally by successful cooperation with key retail chains; loan portfolio risk costs are at a record low.
In Vietnam, similar partnerships with large and small retailers has ensured the company maintains its leading market shares in consumer durables and motorbikes. The business won regulatory approval to launch its first credit card in late 2017. New loan volume reached EUR 1.1 billion, representing a year-on-year increase of 51.3% on a local currency basis.
SUSTAINABLY-PROFITABLE HOME MARKETS
The Czech Republic - the Group’s home market which delivers sustainable long-term profitability - serves as an incubator for piloting new innovations, concepts and solutions. Air Bank continues to redefine customer experience in local retail banking. In its fifth year, Air Bank continued to attract new clients, setting the stage for gaining its 600-thousandth customer in January 2018; it remains the fastest-growing bank on a market of 10 million people. Air Bank’s market share of overall loans to individuals (excluding mortgages) reached 10 per cent. Its “MyAir” mobile app offers attractive non-banking services to the bank’s customers.
“Zonky”, our peer-to-peer online lending platform, is a strong success. Since it was founded in 2015, it has mediated EUR 97 million in loans; in 2017 alone, borrowers raised EUR 77 million. Ten thousand investors (out of its 17,000-strong investor community) actively participate in lending each month, and their individual exposure averages EUR 1,800. Since 3Q2017 Zonky also offers investors a secondary market where they can buy or sell their shares in individual loans.
UP-AND-COMING GROWTH MARKETS
In India, Home Credit reached 20,494 points-of-sale, mostly operated by partnering retailers’ employees. This model improves distribution coverage and is cost effective. The business leverages cooperation contracts with all mobile phone manufacturers to bring zero- or low-interest financing. In line with the country’s efforts to reduce cash-based transactions, our customers can choose from a variety of new e-payment channels accessible through our mobile app, which also contributes to a positive customer experience. The app also serves as a cross-sell channel for lower-risk customers.
In our other growth markets, Indonesia and the Philippines, the Group continued to expand its distribution network. Our business in Indonesia almost tripled its network to 11,400 points of sale and added over 800 thousand new customers. In 2017 it cemented its preeminent market position in financing consumer durables. In the Philippines, Home Credit has finished its distribution rollout project and is now present across all but one provinces with 4,110 points of sale; we are the undisputable leader in this market. Indonesia and the Philippines both achieved run-rate profitability during the fourth quarter.
In the United States, where we operate a joint venture with Sprint Corporation, our scorecards tailored specifically for the U.S. near-prime and sub-prime segments proved their uniquely strong predictive power. They enabled Sprint to increase take-up rates by 20% without compromising its portfolio risk profile. In the fourth quarter of 2017 Home Credit U.S. introduced a credit card co-branded with Sprint, offered to its customers throughout the Sprint distribution network.
CHINA, A SIGNIFICANT CONTRIBUTOR IN A GROWING AND STUCTRALLY IMPROVING MARKET
In China, Home Credit issued EUR 13.3 billion in new loans in 2017, compared to EUR 6.7 billion in 2016, and continued focusing on customers underserved by traditional banks. Home Credit China has achieved scale and is now focused on implementing a number of initiatives to increase efficiency across front- and back-end processes. Accordingly, the business is fine-tuning its distribution network, expanding alternative models which are operated directly by partnering retailers, and continues to roll-out innovative fintech features to further optimize costs. As the Group prudently continues to grow its online business, the proportion of customers’ self-service through online processes has materially increased. Home Credit China introduced a revolving loan designed for this market: a QR code-based product for the purchase of consumer durables with a discount, which is instantly available through our mobile app.
At the same time, Home Credit continues to be rated highly for financial inclusion and customer experience in the prestigious study by The Center for China in the World Economy (CCWE) at Tsinghua University.
New regulations aimed at curbing the growth of unregulated microfinance companies and P2P platforms as well as capping the maximum interest rate has led to some short-term market challenges. We welcome these reforms and believe that these changes will be beneficial for both the industry as a whole and Home Credit China in particular, where we are already fully regulated. In the short term however, in common with our peers, we are witnessing what we expect will be a temporary increase in risk costs.
HIGHLIGHTS
- The Group posted a net profit of EUR 244 million in 2017, compared to EUR 210 million in 2016. This is comprised of EUR 256 million attributable to shareholders of Home Credit B.V. and EUR -12 million that falls under the Group’s consolidated reporting but is attributable to our joint venture partner in the U.S. The profit was mainly driven by a strong performance in Russia and continued growth across our mature businesses in Asia.
- New loan volumes totaled EUR 20,693 million in 2017, an increase of 79.4% from EUR 11,536 million in 2016. A highlight was Russia, where new loan volumes increased 40% to EUR 3,014 million. In Asia, new loan volumes were particularly strong, increasing 216% in India to EUR 864 million, 180% in Indonesia to EUR 352 million, 220% in the Philippines to EUR 338 million, and almost doubling in China to EUR 13 billion.
- Home Credit continued to diversify its funding sources by expanding its portfolio of funding partners and instruments, which has led to a more stable funding base and lower costs. In China, the number of banking partners increased almost four-fold alongside a continued program of capital market issuance.
- The number of active customers reached 29.9 million as of 31 December 2017, from 20.1 million a year ago.
- The quality of the Group’s loan portfolio slightly decreased due to higher loan volumes, which was compensated by the roll-out of risk-based pricing. Through the course of the year, the Group further enhanced its risk prediction models to limit the volatility of risk costs. These enhanced models were introduced to most of our businesses in 2017 and will be rolled out to the rest of the Group this year. The NPL share (i.e. loans more than 90 days overdue) of the gross loan book was 6.9% as at 31 December 2017 (6.1% as of 31 December 2016), while NPL coverage remained at a conservative 121.7% (compared to 128.2% in 2016). The Cost of Risk Ratio increased to 8.9% from 7.6% a year earlier.
- Operating income increased to EUR 3,123 million (2016: EUR 2,000 million) driven by an increase in net interest income to EUR 2,417 million (2016: EUR 1,532 million).
- The Group’s general administrative and other operating expenses rose in 2017 to EUR 1,626 million from EUR 1,115 million a year earlier. The Cost to Income Ratio for 2017 fell to 52% from 55.7% in 2016.
- HCBV’s customer deposits increased 17.7% to EUR 6,356 million as of 31 December 2017, from EUR 5,401 million in 2016.
- The Group’s capitalization remained solid with total equity of EUR 2,028 million and an Equity to Asset Ratio of 9.4%.
- HCBV’s multi-channel network consisted of 399,228 distribution points globally as of 31 December 2017, up 47.6% compared to 2016. In addition, the Group has strongly expanded its online presence.
Business Results | As at Dec 31, 2017 | As at Dec 31, 2016 | Change,% |
Loans granted YTD (EUR millions) | 20,693 | 11,536 | 79.4% |
Number of active clients (millions) | 29.9 | 20.1 | 49.1% |
Number of distribution points | 399,288 | 270,537 | 47.6% |
- Number of POS´s and loan offices | 397,190 | 268,486 | 47.9% |
- Number of bank branches | 308 | 328 | (6.1%) |
- Number of post offices | 1,730 | 1,723 | 0.4% |
Number of employees (thousands) | 157.7 | 120.2 | 31.2% |
Profit and Loss (EUR millions) | 2017 | 2016 | Change,% |
Net interest income | 2,417 | 1,531 | 57.8% |
Operating income | 3,123 | 2,000 | 56.2% |
Credit risk costs1 | (1,124) | (563) | 99.6% |
Operating expenses2 | (1,626) | (1,115) | 45.8% |
Net result for the year | 244 | 210 | 16.2% |
Net profit attributable to equity holders of the parent | 256 | 213 | 20.2% |
1) Credit risk costs represent impairment losses on the loan portfolio
2) Operating expenses comprise general administrative and other operating expenses
Financial Position (EUR millions) | As at Dec 31, 2017 | As at Dec 31, 2016 | Change,% |
Total assets | 21,526 | 14,704 | 46.4% |
Net loan portfolio | 15,452 | 9,866 | 56.6% |
Total equity | 2,028 | 1,501 | 35.1% |
Wholesale funding | 11,979 | 7,136 | 67.2% |
Customer deposits and current accounts | 6,356 | 5,401 | 17.7% |
Source: Home Credit B.V., consolidated.
Profit and Loss Ratios | 2017 | 2016 |
Net interest margin1 | 14.7% | 14% |
Net interest income to operating income | 77.4% | 76.6% |
Cost to average net loans2 | 12.9% | 15.1% |
Cost to income ratio3 | 52.0% | 55.7% |
Cost of risk ratio4 | 8.9% | 7.6% |
ROAA5 | 1.4% | 1.8% |
ROAE6 | 14.5% | 16.2% |
Financial Position Ratios | As at Dec 31, 2017 | As at Dec 31, 2016 |
Net loans to total assets | 71.8% | 67.1% |
NPL ratio7 | 6.9% | 6.1% |
NPL coverage ratio8 | 121.7% | 128.2% |
Deposits to total liabilities | 32.6% | 40.9% |
Equity to assets | 9.4% | 10.2% |
Equity and deposits to net loans ratio | 54.3% | 70.0% |
Source: Home Credit B.V., consolidated.
Notes:
1) Net interest margin is calculated as net interest income divided by the average balance of net interest earning assets.
2) Cost to average net loans is calculated as general administrative and other operating expenses divided by average net loans.
3) Cost to income ratio is calculated as general administrative and other operating expenses divided by operating income.
4) Cost of risk represents impairment losses divided by average balance of net loans to customers.
5) RoAA is calculated as net profit divided by average balance of total assets.
6) RoAE is calculated as net profit divided by average balance of equity.
7) NPL ratio is calculated as gross non-performing loans divided by total gross loans. The Group defines non-performing loans as collectively impaired loans that are overdue by more than 90 days as well as loans considered individually impaired.
8) NPL coverage ratio is calculated as loan loss provisions divided by gross non-performing loans.